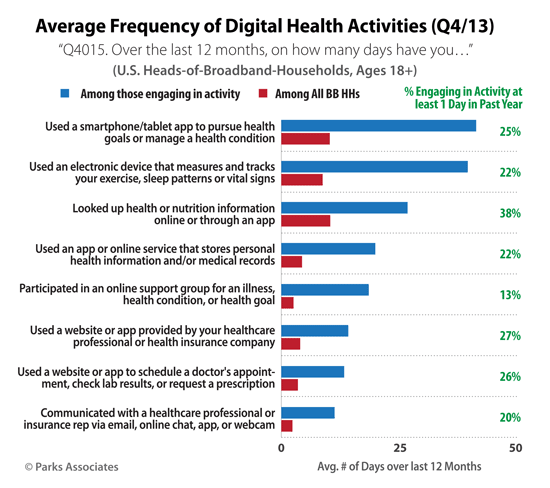
Matthew Holt at Health 2.0 had a few questions regarding recent Parks Associates data on consumers’ digital health activities published in this infographic. Thanks, Matthew, for your interest in our data and for starting this discussion.
First, the data source. Parks Associates fields consumer surveys throughout the year on emerging consumer technologies and technology-related services, including those in the digital health space. This particular infographic pulls from a survey fielded to heads-of-broadband-households in the U.S. Parks Associates fielded the survey in Q4 2013.
Matthew was particularly interested in two figures:
- The percent of consumers looking up health info online (38% in our graphic), and
- The percent of consumers using a device to track their health patterns (22% in our graphic).
Both of these data points come from a question that was shown to all respondents (heads-of-broadband-households ages 18+). The sample base for this question was 832, with a margin of error of ±3.4%. The wording for both questions was shortened for the infographic. The exact wording of the question for these two data points was as follows:
“Over the last 12 months, on how many days have you….
- Looked up health or nutrition information online or through an app?
- Used an electronic device that measures and tracks your exercise, sleep patterns or vital signs?”
Valid responses ranged between 0 and 365 days that the respondent performed the activity. Anyone who had performed the activity on at least 1 day was included as part of the total percentage of consumers who had performed the activity in the previous 12 months. Is this a complicated way of getting at the precise data in the infographic? For sure. But the primary goal of the original question was to gauge the frequency with which consumers engage in the tested activities. On that point, here are our findings:

Our survey found that, of the digital health activities tested, consumers most frequently use their health apps, use their tracking devices, and look up health information online or through apps. Activities that involved care providers and health insurers are far less frequent, which makes sense given these interactions are more episodic in nature.
Back to Matthew’s original concern: is our figure too low for the percentage of consumers looking up health information online in a 12-month period? I took a look at PewResearch’s recent Health Online 2013 report by Susannah Fox and Maeve Duggan. The authors found that “72% of Internet users looked online for health information of one kind or another within the past year.” To reach this statistic, the question lists 12 different types of health-related information a respondent might search for online, including traditional health topics like “a specific disease or medical problem” and “how to lose weight or how to control your weight,” as well as topics related to navigating healthcare more generally, like “how to reduce your health care costs,” “health insurance, including private insurance, Medicare, or Medicaid,” and “medical test results.” This list also includes topics that fall on the fringes of health information, such as “food safety or recalls.”
The Pew study’s figure is very comprehensive and includes in one percentage (72%) all of those different types of health information for which a consumer might seek. By asking the question in this way, Pew did a great job of really probing the respondent to think about all of the health topics he or she may have researched over the past year.
Ultimately, the Parks Associates figure is lower for two reasons:
- The question breaks out into different “activities” some of the information areas that the Pew study incorporates into one figure – for instance, Parks Associates separates the action of visiting a care provider or health insurer’s website into its own option.
- Parks Associates asks respondents to specify the number of days on which an activity was performed in the past year. This question form requires a bit more commitment from respondents than a basic yes/no question in that it requires respondents to not only think about whether they did an activity, but how often.
Given these considerations, I do believe the actual percentage of U.S. consumers who look up a broad range of health information online to be likely higher than 38%.
The second data point Matthew referenced indicates that 22% of consumers use a device to track their health patterns, which he felt was too high. While I could not find a similar data point from the Pew survey, I would note that the full question wording specifically includes exercise, vital sign, and sleep tracking devices and does not specify form factor. I cross-referenced this data point with data from an older survey (Q4 2012) and found that 18% of U.S. broadband households used a device to collect health data and then transfer that data electronically to their computer, mobile phone, or doctor. Given the margin of error, a year’s difference, and the rise in popularity of wearable fitness trackers, I don’t believe the 22% figure for end-of-year 2013 to be unreasonable.
I hope this background gives some insight into how Parks Associates performed this data crunching. As always, myself or one of my colleagues is happy to discuss the data at greater length – reach out to me.


